
Eliminate Slow Queries with Ecto Telemetry
You have slow database queries. How do we identify them? And how can we visualize the overall performance of our application’s database performance?
With Telemetry!
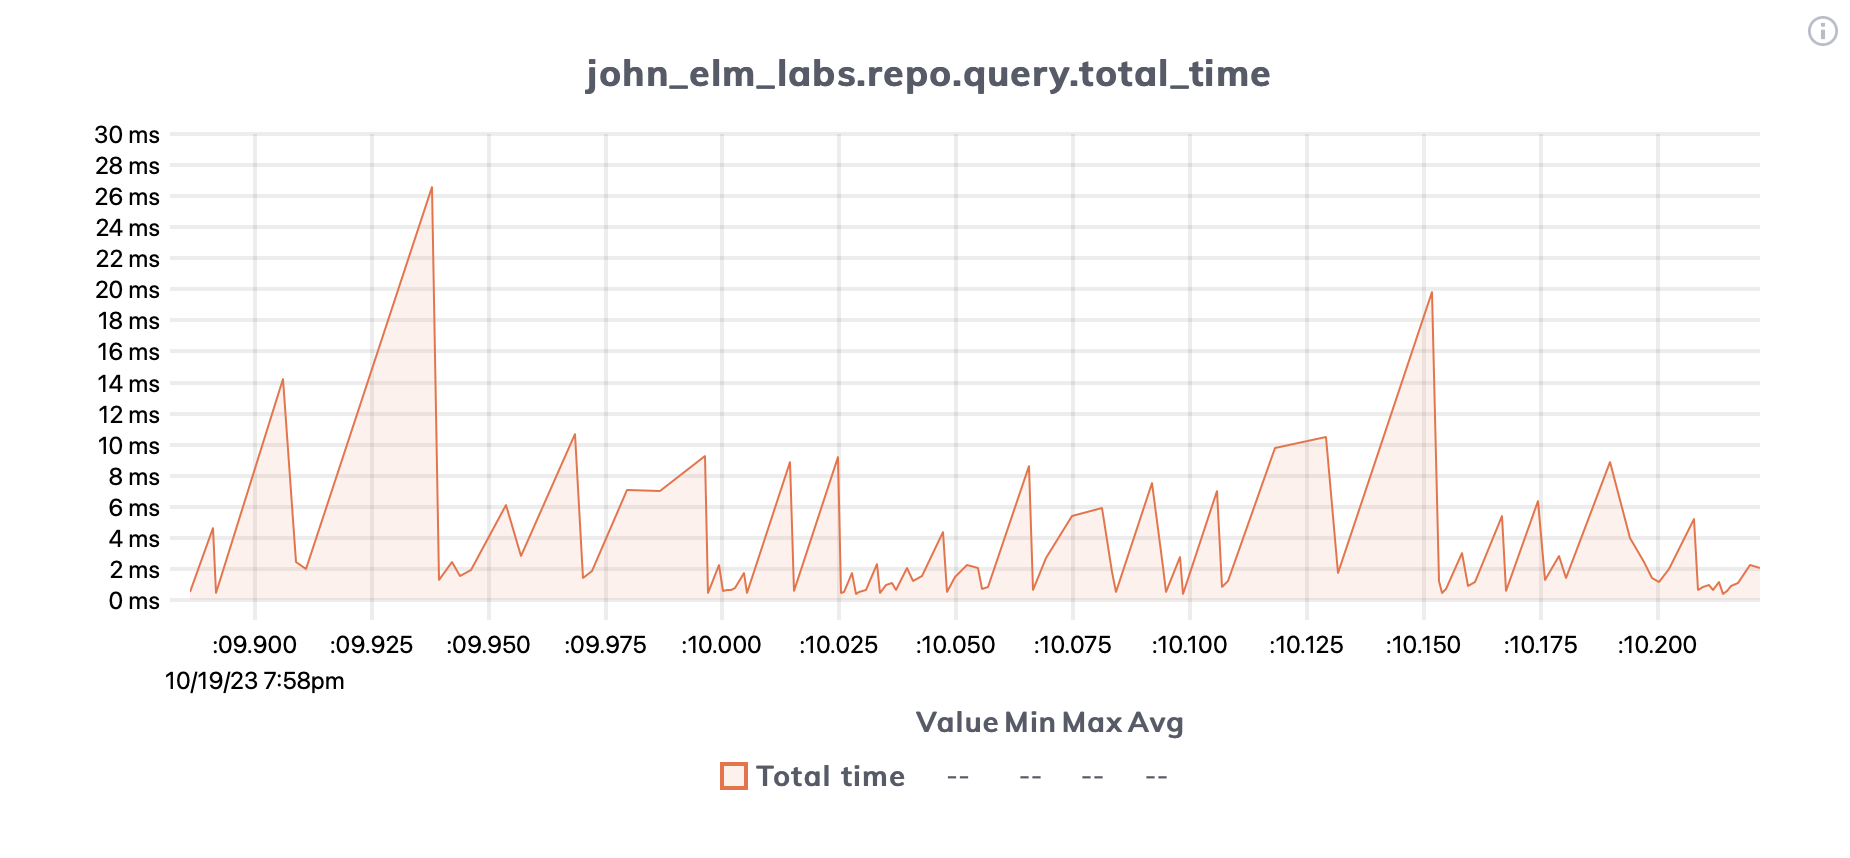
Telemetry can show us exactly where database performance bottlenecks live and even give us fancy graphs and charts on LiveDashboard:
What is Telemetry?
So, what is Telemetry, how do we use it, and why is it helpful?
Telemetry, as described by its documentation, “is a lightweight library for dynamic dispatching of events, with a focus on metrics and instrumentation.”
In plain English, it’s another introspection tool available to us in the BEAM ecosystem that provides insight to our running system(s).
Telemetry emits events that include measurements and metadata at different points during the execution of processes.
For example, some of the events exposed by Phoenix LiveView are:
-
[:phoenix, :live_view, :mount, :start]- Dispatched by a Phoenix.LiveView immediately before mount/3 is invoked. -
[:phoenix, :live_view, :mount, :stop]- Dispatched by a Phoenix.LiveView when the mount/3 callback completes successfully. -
[:phoenix, :live_view, :mount, :exception]- Dispatched by a Phoenix.LiveView when an exception is raised in the mount/3 callback.
Every time a LiveView starts or stops its mount or throws an exception, a telemetry event is emitted. We can attach event handlers to these events to investigate performance and log behavior, among other things.
How to Log Slow Ecto Queries
Ecto exposes the [:my_app, :repo, :query] event every time a query is executed. AKA, every Repo operation invoked. Read the section on Ecto’s Telemetry Events for more info.
You can attach to this event to find slow queries.
The :query event will contain timing information for each stage of the executed query. The measurements map passed to our event handler will contain:
-
:idle_time- the time the connection spent waiting before being checked out for the query -
:queue_time- the time spent waiting to check out a database connection -
:query_time- the time spent executing the query -
:decode_time- the time spent decoding the data received from the database -
:total_time- the sum of (queue_time,query_time, anddecode_time)️
To attach to the query event, we can simply use :telemetry.attach/4 inside of init/1:
# lib/app_web/telemetry.ex

def init(_arg) do
  # other stuff

  :ok = :telemetry.attach("ecto-handler", [:telemetry_demo, :repo, :query], &TelemetryDemoWeb.Telemetry.handle_event/4, %{})

  # other stuff
end
Next, define the event handler. It doesn’t matter where you define it, but since it tends to be pretty small, leaving it in the Telemetry module is generally a fine place. You can tell the attach/4 function where your event handler is located with the 3rd argument.
A simple event handler may inspect the time of each operation:
# lib/app_web/telemetry.ex

def handle_event([:telemetry_demo, :repo, :query], measurements, metadata, config) do Enum.each(measurements, fn {k, v} ->
    ms = System.convert_time_unit(v, :native, :millisecond)
    IO.inspect "#{k}: #{ms} milliseconds"
  end)
end
Afterward, in the console, you may see something like this:
# in IEx, you'll see:
"idle_time: 1454 milliseconds"
"decode_time: 1 milliseconds"
"queue_time: 1 milliseconds"
"query_time: 3 milliseconds"
"total_time: 6 milliseconds"
Besides the measurements argument, what other information do we get from the :query event? The event handler also receives a metadata map and a config argument. The config argument will be an empty map, because we passed an empty map when we set up our handler with :telemetry.attach/4.
That leaves metadata. What’s inside metadata? Lots of helpful info! Namely, all of the following:
-
:type- the type of the Ecto query. For example, for Ecto.SQL databases, it would be:ecto_sql_query -
:repo- the Ecto repository -
:result- the query result -
:params- the dumped query parameters (formatted for database drivers like Postgrex) -
:cast_params- the casted query parameters (normalized before dumping) -
:query- the query sent to the database as a string -
:source- the source the query was made on (may be nil) -
:stacktrace- the stacktrace information, if enabled, or nil -
:options- extra options given to the repo operation under:telemetry_options
Of particular interest to us is the :query key. If we notice a query is running slowly, we want to log it!
Let’s update our event handler to log the :query of our slower queries (greater than 500ms):
def handle_event([:telemetry_demo, :repo, :query], measurements, metadata, config) do
  query_time = measurements.query_time
  ms = System.convert_time_unit(query_time, :native, :millisecond)
  if (ms > 500) do
    Logger.debug "Slow query detected. Query: #{metadata.query} Stacktrace: #{inspect(metadata.stacktrace)}"
  end
end
With this event handler, slow query logs will look a bit like this:
[debug] Slow query detected. Query: SELECT u0."id", u0."email", u0."hashed_password", u0."confirmed_at", u0."inserted_at", u0."updated_at" FROM "users" AS u0 Stacktrace: [{Ecto.Repo.Supervisor, :tuplet, 2, [file: ~c"lib/ecto/repo/supervisor.ex", line: 163]}, {JohnElmLabs.Repo, :all, 2, [file: ~c"lib/john_elm_labs/repo.ex", line: 2]}, ... # rest of stacktraceNow you know exactly which query was slow and exactly where it was invoked from!
Show Measurement Graphs on LiveDashboard
How do we get the graphs shown at the top on LiveDashboard?
Well, if your LiveView project is new enough, you can try visiting http://localhost:4000/dev/dashboard/metrics and seeing if the Ecto graphs show up there (they are included by default on newer projects).
If metrics were not automatically set up for your project, you’re going to want to define the Ecto metrics in telemetry.ex:
# lib/app_web/telemetry.ex

def metrics do
  [
    # Database Metrics
    summary("app.repo.query.total_time",
      unit: {:native, :millisecond},
      description: "The sum of the other measurements"
    ),
    summary("app.repo.query.decode_time",
      unit: {:native, :millisecond},
      description: "The time spent decoding the data received from the database"
    ),
    summary("app.repo.query.query_time",
      unit: {:native, :millisecond},
      description: "The time spent executing the query"
    ),
    summary("app.repo.query.queue_time",
      unit: {:native, :millisecond},
      description: "The time spent waiting for a database connection"
    ),
    summary("app.repo.query.idle_time",
      unit: {:native, :millisecond},
      description:
        "The time the connection spent waiting before being checked out for the query"
    ),
  ]
end
Each one of these will define a metric / graph for each of idle, decode, query, queue, and total time for Ecto queries.
With the metrics defined, make sure that your live_dashboard route is using your telemetry module. It should look something like:
# router.ex
live_dashboard "/dashboard", metrics: AppWeb.Telemetry
And that’s it! You should now see Ecto performance graphs on LiveDashboard!
For more info on configuring metrics you can visit Configuring metrics in the LiveDashboard docs.
Wrapping Up
We learned what telemetry is, why it’s helpful, how it works, and how to use it in an Elixir / Phoenix app. With it, we enabled a powerful debugging tool (logging slow queries) and are able to visualize the performance of our application with metric graphs that are picked up by LiveDashboard!